Market Defiance Part 2: The ‘Covfefe’ Conundrum & The Crash To Come
Market Bash: Trump Tribute
A heartfelt thank you to Donald Trump for the word of the week, month and possibly, the year—COVFEFE, because there is no getting over this week which can only be expressed in a term as unfathomable as Covfefe, as we struggle with the conundrum stock and bond markets presented to us—wavering between economic prowess or looming recession.
Fresh record highs for the S&P 500, Dow Jones, Nasdaq, DAX and FTSE, with Asia-Pacific represented by the KOSPI, SENSEX and ASX, this week’s North Korean new missile test all priced-in. Yet we also have a record low in the US treasury yields, the bond market seeing yields fall to their year-to-date lows with price gains even for embattled Brazil.
What a “covfefe” moment for us, emerging from last week’s series of terror attacks around the world to be horrified by the audacious bombing in, possibly the safest expatriate district of Afghanistan that killed 90 people and wounded hundreds more, only to be numbed by the next attack in a Genting co-owned casino in Manila that killed just 36 from smoke inhalation, that was possibly unplanned. As we write, London is under siege again, making BBC’s poor tasting “get used to it” comment last week seem almost prescient.
If we could pause for a bit to realise there has not been a terrorist act on American soil since Trump took office (applause, please). On the contrary, all we read about are reports of neo-Nazi plots and steady stream of hate crimes against minority folks.
To say something about the Paris climate deal and Donald Trump’s decision to pull out, we can be sure that Trump is not to blame for the iceberg 300,000 times the size of the one that sunk the Titanic splintering off the 4th largest ice shelf of the Antarctica, right at this moment. It speaks so much for the Paris climate deal, so far, as we can discern more dead fishes amongst the plastic and styrofoam trash in the Singapore river these days, and with the last Ice Age ending some 12 millennia ago, before the advent of styrofoam, it is hard to tell.
Source: ABC News Australia
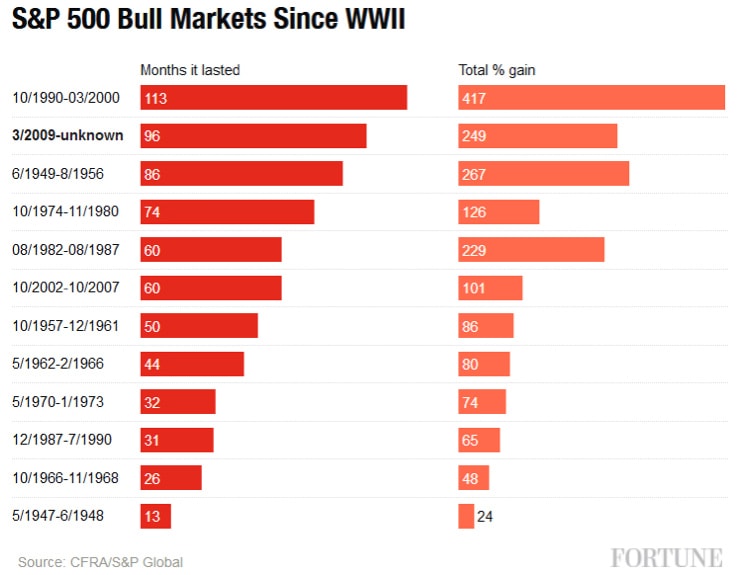
Now, if only we could give Donald Trump due credit for the second-longest bull run in US history (98 months) which has powered ahead a bit more this week along with the powerful rally in the bond markets.
End of Bash.
Tribute To The Conundrum of the Second Longest Bull Run in History
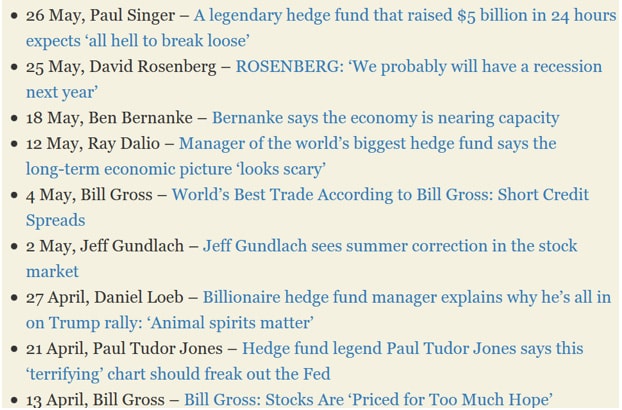
Last week, we wrote about the conspiracy theories and the experts’ views in our piece, Stock Market Defiance and The Coming Crash, that the market is due for a correction even as it demonstrates a defiant sort of resilience currently.
Since the Fortune magazine’s 8th birthday report card on the current second longest bull run in March, we have added 2 more months to the record with a consolation that the “S&P 500 was trading at a multiple of 30 times earnings when the dot-com bubble burst in 2000, and 26 times earnings when it was the same age as the current bull; today, the S&P 500 has price-to-earnings multiple of about 25.” Although we can safely note that no bull market has ever made it past its 10th birthday, it did take the FOMC no less than 7 rate hikes to pop the longest bull back in 2000.
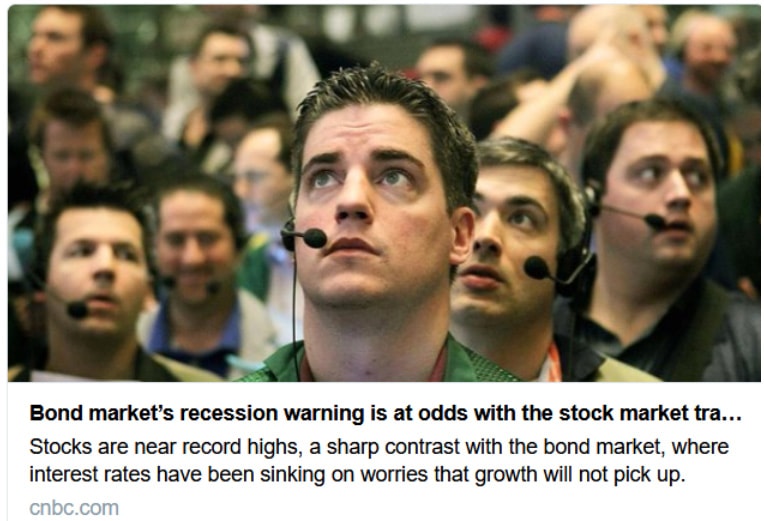
The big rally in both stocks and bonds has got everyone questioning about the “invisible hand” who dares to defy the Federal Reserve of the United States whose speakers for the week declared between 2 to 3 rate hikes this year and were all in agreement for the shrinking of their $4.5 trillion balance sheet which brings us right to my conundrum of the bonds versus stocks where one is signaling a recession and other, an economic boom ahead.
Perhaps it is just too early to worry about the Fed yet because we do have the British elections coming up next Thursday, and a dismal 138k new jobs created Non-Farm Payroll survey on our hands, which is bad news in spite of the glaring error in the Challenger Job-Cuts Report that was re-stated as less than estimated the following day due to, of all things, Trump-endorsed Ford which added 700 jobs to Trump’s credit back in January but is now laying off 1,400 (instead of the 20,000 reported).
Stranger Things—Is The Trump Trade is Dead?
Donald Trump can claim scant credit for all these even “stranger things” happening in the stock world where Goldman Sachs is relegated to 28th largest bank in the world and Venezuela’s Mercantil Servicios Financieros (MVZ VC) charges to 1st spot out of nowhere and claims the 9th largest market cap in the world, ahead of Tencent, Alibaba and JP Morgan, climbing from 154th place in 2016.
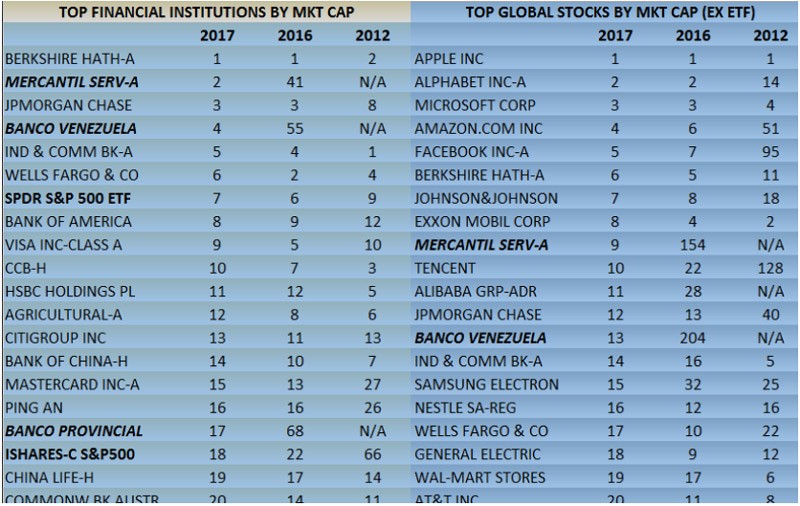
Table of the top 20 financial institutions and stocks as of Jun 2017, Source: Bloomberg
In a world where the SPDR S&P500 ETF claims 7th spot and we have 2 S&P 500 ETFs’ in the top 20 financial institutions, we would expect the recent rally to be caused by index buying?
And yet it is not, for it has not been a broad based rally that index buying would lead it. As many observers have pointed out, if we take to task the top 12 stocks of the S&P 500, the 6-month gains of the top 6 eclipse the next 6 largest constituents of the index.
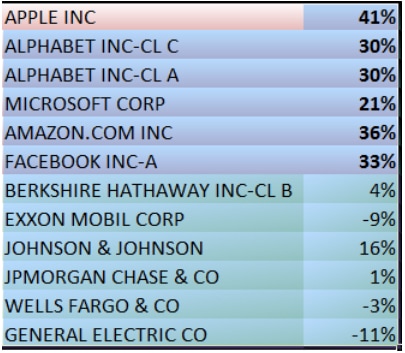
Table: 6-month performance of the top 12 stocks of the S&P 500
The same broad divergence of performance is observed for the top 20 stocks of the Nasdaq which is making new peaks weekly.
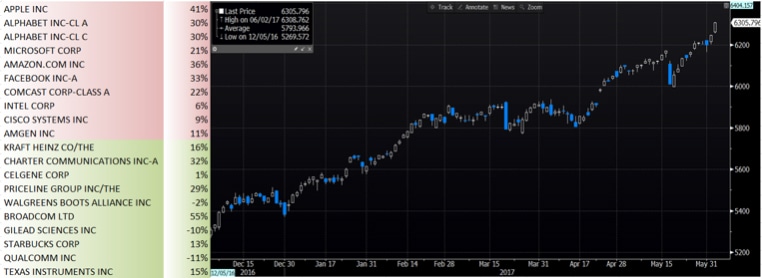
Table: 6-month Performance of the Top 20 stocks of the Nasdaq
Yes, it has been a tech rally, as we come to realise that the Trump trades (Construction, Materials, Financials etc) are towing the line if we take a look at the year to date performance of the S&P 500 constituents and see the breathtaking returns of the S&P 500 Info Tech Index.

Table: Year-to-date returns on S&P 500 by sector
The Smart Money Talks
Like we noted last week, big names are calling for a correction and we gave a rough list of recent comments from industry bigwigs and experts.
Unexceptionally, this week, we have BlackRock CEO Larry Fink stating the US markets are fully priced, along with a warning on poor 2nd quarter earnings, echoing JP Morgan, Morgan Stanley, Bank of America and Citibank who are all telling investors to expect trading revenue declines.
Are the smart money putting their money where their mouths are? CFTC net positioning for S&P futures are showing big short positions versus the long positions for the eMini S&P, the contract favoured by smaller players, as we note the US$6 bio inflow into the SPDR S&P 500 ETF for the week ending 1 Jun 2017.
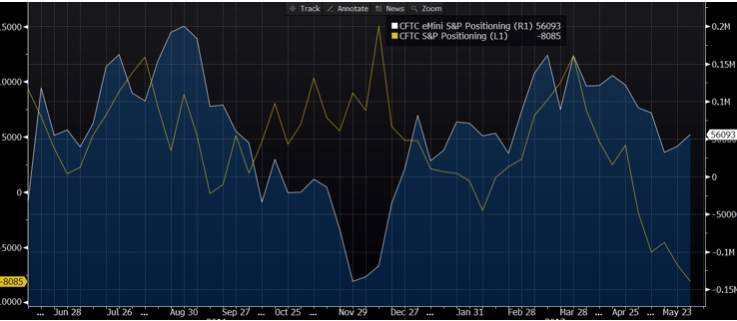
Chart of net positions in the eMini S&P vs the S&P futures.
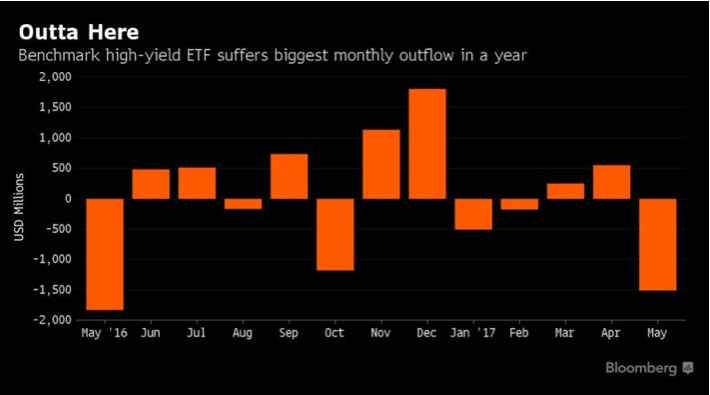
We cannot say that all ETF investors are “not smart” because the first sign of panic is coming from the largest junk bond ETF managed by BlackRock, HYG US, which has suffered its biggest monthly outflow in a year, according to Bloomberg.
There is a lot more complacency where that is coming from in sunny Asia, where credit spreads are tightening to painful new lows each day as fund managers put off hedging in favour of carry or, in fear of paying their insurance premiums too early. However, we will leave that story for another time as we come to the shadowy cult-followed indicator to make the case for a crash.
Presenting The 2017 Edition of the Hindenburg Omen
We are not sure about the H-Omen anymore after getting so excited about it over the years when it visited the NYSE Index frequently between 2013 to 2015. Each time it came, the market only went higher, for that fateful period, until the final “omen” back in June 2015 which gave us a nice 13% crash in August but failed to prepare us for that 15% Feb 2016 crash (Nov15 to Feb16).
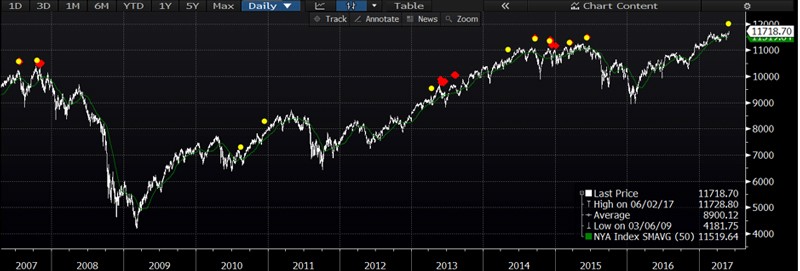
Chart: Hindenburg Omen 10 year
Bloomberg Definition of the Hindenburg Omen – The Hindenburg Omen is a combination of technical signals that together forecast the likelihood of a stock market crash. The technical inputs are the 10 Week Simple Moving Average, New 52 week highs on the NYSE, New 52 Week lows on the NYSE, and the McClellan Oscillator.
If, on the same day, a) the 10 Week Moving Average is rising, b) New Highs and New Lows are greater than 2.2% of total issues traded, c) the McClellan Oscillator is negative, and d) New Highs are less than or equal to twice the New Lows then a Hindenburg Signal is indicated by a yellow circle.
Two such signals within a 36-day period are considered a Hindenburg Omen, indicated by a red diamond. The Hindenburg Omen portends a serious decline within the next 40 days.
Hindenburg’s claim to fame was incorrectly anticipating the 1987 and then, the 2008 market crashes but has a 30% hit ratio which means 70% miss, as CNBC skeptically put it last month.
Each of the “omens” over the past years has come at or around the new market tops, although this is the 10th time it has ever triggered for the NYSE and the Nasdaq on the same day.
Solving the Covfefe Conundrum
It is the confluence of the conspiracy theories and expert views that we pointed out last week, the geopolitics, terror attacks, higher market expectations highlighted by a Yale study, the disproportionate ratio of heavyweights in the indices buoying them higher, the FOMC coming up in less than a fortnight, the incredible rally in bond markets that fears not rate hikes, the Hindenburg and the uncomfortable feeling in the pits of the tummy.
Bonds are signalling long term pains and stocks are going for the short term gains. And the trigger point for a reality check for both of them? The FOMC should set them straight, and hopefully not have both running for the door.


